Wednesday, December 18, 2013

Network Analysis

Goals and Objectives

The goal of this assignment was to be familiarized with network analysis in ArcGIS. The objectives to be fulfilled was to learn to load features into Network Analysis window, calculate a route for trucks carrying sand, find the closest facility and best route to that facility, build a model that would calculate the closest facility, and find the cost incurred by each county,

Methods

To create a network analysis system I had to add the streets network data to ArcMap. The Network Analyst Extension was turned on after streets were added. If the streets were added after the extension would not have worked. I added all the geocoded mines from our previous exercise and queried out all mines that were rail loading locations as well. These mines were then merged together with the rail_terminals2 from the Ex 7 folder. Next was to load all the mines as stops with the Network Analyst. Next was to run a closest facility layer with the stops as facilities and the mines as incidents. I had to edit all the mines that were irrelevant to the situation. The next step was to build a model that would run similar to the closest facility this is shown below.

Results
The mines were found using Network Analyst and Model Builder. 
Conclusions

The Network Analyst tool ran very smoothly and efficiently.

Data Downloading and Collecting

Goal

The goals and objectives of this lab were to download data from different sources on the internet and import that data to ArcGIS, join the data together, project the data in one coordinate system, and design a geodatabase for the data.

Methods

The first website that the data was downloaded from was the National Atlas. The data at this site was railroad data. The data was in shapefile format, The file was zipped when downloaded. I had to extract it or sometimes referred to as unzipping. Next I was to download data from USGS National Map Viewer. The data downloaded from this site was Land cover data for Trempealeau County. Unlike the railroad data this data was not easily downloaded. I had to receive it via email. Again after downloading I had to unzip the file. The next website to download data from was the MRLC website. This data was for elevation data and was a DEM. Like the land cover data it was ordered by email. I had to Mosaic the grids together to get a complete cohesive image. USDA was the next website that I gathered data from. The data for this was land cover data for crop lands. Like the previous two processes I received this via email. Soils for Trempealeau County was next.

For the next part I viewed some of the data in Microsoft Access. The data that was viewed was in a geodatabase format.

Creating a geodatabase for all the data I gathered was next. I had to make feature datasets for my data and set a coordinate system. I had to import all my data to the geodatabase and create a relationship class. For the data that was not in the correct coordinate system I had to project that data so that it matched up with the geodatabase. I had to create a map document for all my features.


Conclusion

This lab was not only practical but also fun. The shutdown of the Government did cause some fault with the collection of data.


Friday, October 25, 2013

Geocoding Sand Mines

Goals and Objectives
This exercise was a continuation of obtaining information on sand mines for GIS II. The goal was to find, geocode, and compare sand mine locations gathered by myself and my classmates. Geocoding is the process of locating places using information gathered via table or other informative sources. Sometimes these tables have information that is not needed for geocoding and some of this information is inaccurate. To fix this is called normalizing data which I had to do to make my data legible.


Methods
I had to use the geocoding tool in ArcMap to find the sand mines that were assigned to me. There are two methods of geocoding. The first method is to use an address locator. By placing the address in the locator a point appears on the map I was using to look for the sand mines. The other method is to manually find a sand mine using an aerial image and then placing the point on the map. I used the address locator technique because in the table there was already a listed address which made it easier to find the sand mine. There is the potential for interference as some addresses possibly could have been incorrect or the point was not close enough even though the address was correct. The second method was needed due to the fact that some of the addresses were missing or were proposed mines that did not have addresses; and in their place were descriptions of placement. An example of a description would include sections and directions like southwest or southeast. After I had placed all my points I entered them into the classes’ Exercise 6 folder for use by myself and my classmates.

The next step in this process was to merge all of the shapefiles together except for mine. A simple merge with the merge tool was used to create a new shapefile in a geodatabase. Following this I had to query out all the mines that had the same unique ID as mine. I made a new feature class with these points and added in my points. Most of points lined up well with my classmates and some were off. The final step in this was to use the point distance tool in ArcMap. This tool measured the distance between the placed points and displayed them in a table to view. Many off these points had large numeric distances which could have been an operator error or a service error.

Results
Below are images of my results including a map of my mines and my classmates mines, a point distance table, and before and after normalization of the mine table.

Here is the map of my mines and the same mines assigned to others. As you can see some are close and others have quite a distance between them.
Here is the distance table showing how far my mines were to other's mines.
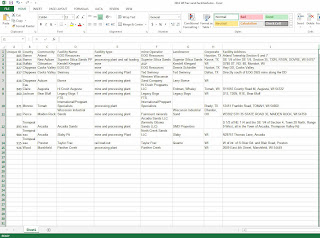
Before normalization which includes unnecessary fields.
The table after normalization without any irrelevant fields.


Discussion 
Errors do happen and this is due to two ways. One is inherent and the other is operational. Inherent errors happen because of the complexity of the real world and the lack of computational data to accurately represent these limitations. Inherent errors also occur because of usage of coordinate systems. Coordinate systems are not perfect and therefore must distort some feature of the Earth. Operation errors are errors that occur due to user errors and interpretations. A single misplaced keystroke could cause data to be useless. Other procedures can skew results like the wrong aerial interpretation or wrong usage of algorithms to solve problems.

Conclusion
This exercise was very helpful and useful. I had no idea how to geocode prior to this and it was also useful to help show that errors do occur in even the most important processes. 

Citations
Lo, Chor Pang. (2013) "Concepts and Techniques of Geographic Information Systems." (2006)


Tuesday, October 8, 2013

Frac Sand Mining

Overview

Frac sand mining in recent years has started to become a major industry and issue in Wisconsin. Sand mining in Wisconsin goes back over a century of time, but frac sand mining is relatively new due to the cost effectiveness in use.

First off, frac sand is being used to remove natural gas and oil from wells. This process is called hydrofracking, fracking, or hydraulic fracturing.  Oil and natural gas companies dig down into their wells and create cracks. The sand being used is called frac sand which is silica sand or quartz. Frac sand comes in when the cracks in the wells need to be expanded. Frac sand is mixed with water and is injected into the cracks at immensely high pressure. The sand opens up the cracks and keeps them open to make extraction of gas and oil much easier. Gas and oil wells are not operated in Wisconsin, only sand mines.


Frac sand or silica sand is the sand used in fracking. This sand must meet standards to be considered for fracking. The standards that the sand must be almost pure quartz, be of uniform size and shape, and be very strong. The sand is found mainly in glacial deposits and sandstone. Which both happen to be in abundance in Wisconsin. Mainly in Western Wisconsin with some in Eau Claire county. As of January 2012 there were 60 mining operations, 30 processing facilities operating or under construction, and 20 more being proposed.
The mining of sand comes in many different forms. But, most begin the same. In some occurrences top soil must be removed which done with heavy machinery. Once the soil is removed there are some steps that can be taken to extract the sand. The most common extraction method is using an extractor which is a construction vehicle. Some mines use blasting to make extraction much easier and quicker.  


The concern from sand mining comes from the unknown. As early as 5 years ago frac sand mining was almost unheard of, but know it seems that everyone has an opinion on it. People's fears come from whether or not there is a risk of pollution from particles being deposited in the air from mining. Many others fear that noise is bothersome. Well some just believe that trucks entering and exiting mines are bad for local roads that are not used to heavy traffic.

Sources:
Wisconsin Department of Natural Resources (January 2012) Silica Sand Mining in Wisconsin 
Retrieved from http://dnr.wi.gov/topic/Mines/documents/SilicaSandMiningFinal.pdf

Wisconsin Department of Natural Resources  (Tuesday, October 08, 2013) Silica (frac) sand mining
Retrieved from http://dnr.wi.gov/topic/mines/silica.html

Wisconsin Department of Natural Resources (July 12, 2012) Registering nonmetallic mineral deposits
Retrieved from http://dnr.wi.gov/topic/Mines/Deposit.html

Wisconsin Geological and Natural History Survery (2013) Frac sand in Wisconsin
Retrieved from http://wisconsingeologicalsurvey.org/pdfs/frac-sand-factsheet.pdf